Home PageFacebookRSS News Feed
PocketGPS
Web
SatNav,GPS,Navigation
SurfShark VPN
eBonTek DL-3200BT Bluetooth GPS Datalogger review

Date 19th August 2007

For some time this year the talk in the GPS industry has shifted from Bluetooth GPS receivers to Dataloggers. First at CES, then at CeBIT, finally at Computex eBonTek gave me my first review sample, the DL-3200BT Bluetooth GPS Datalogger.


The DL-3200BT is based on the MTK GPS chipset, which is very sensitive, accurate and frugal with power. The Datalogger is reputed to run for 25 hours between charges. The device is capable of storing up to 170,000 track points and has the capability to record specific locations.


Once back in the office, or at home, the data can be downloaded from the datalogger and analysed in Google Earth.


These amazing little devices have a large number of potential applications recording all sorts of information. They are passive systems meaning that they can only record data for historic analysis, and not transmit your current position.

Review by Mike Barrett

eBonTek DL-3200BT datalogger

Technical Specifications

I wont bother to print the full DL-3200BT datalogger specs here but just provide the basic details:


Chipset: MTK GPS

Channels: 32 all in view tracking

Antenna: Built in Patch antenna

Sensitivity: -158db

Cold start: 39 secs (open sky)

Protocol: NMEA-0183

Interface: Bluetooth V1.2

PC link: Mini USB (data transfer)

Battery: Li-on 11mAh

Power Charge: 5v Mini USB

Memory: 16Mb

Data points: 170,000

Width: 45mm

Length: 72mm

Depth: 19.8mm


eBonTek DL-3200BT datalogger

The eBonTek DL-3200BT Datalogger

Lets take a quick tour round the device.


Starting at the top on the front you can see a hexagon design as shown in the picture top right. This contains the control indications for the datalogger.


At the top point of the hexagon is the satellite indicator, when it is solid the datalogger is searching for satellites. Once it 'gets a fix' it will start to flash. "A Fix" is the term used when the GPS knows where it is and can start recording.


To the left is the bluetooth indicator. This is only lit when in navigation mode (see later). A solid blue light indicates ready to connect, flashing blue is connected.

eBonTek DL-3200BT datalogger


The final indicator is the power LED. This will light when the battery is running low or the datalogger is being charged.


In the centre of the indicators is a small push-button switch. This is used to record a specific point of interest (POI). If you pass something that you really want to remember simply push this button and it will record the location separately from the track log.


The picture to the right shows the base of the DL-3200BT. This is covered in a non-slip rubber coating. The Datalogger can be placed on the dashboard of your car and will remain there quite securely. Obviously extreme movements may dislodge it, but I found it fine for normal driving.

eBonTek DL-3200BT datalogger

On the left side of the datalogger is a three position slide switch. This can either be set to OFF, NAV, or LOG. When it is in the NAV position the Bluetooth module is activated and the GPS can be connected to a PDA, Mobile Phone or PC to provide GPS data for navigation applications. This works concurrently with the datalogging functionality.


Sliding the switch all the way over to LOG disables the Bluetooth and just records your position in the internal memory.


On the right hand side of the datalogger is a mini USB socket. This doubles as both the power charger and also the port to transfer data from the logger to a PC.


eBonTek DL-3200BT datalogger

The eBonTek DL-3200BT in use

I have been testing the eBonTek datalogger for about a month now in a variety of conditions. The use of the MTK GPS chipset means that even in the most extreme conditions your trip will be logged.


I took the datalogger on a 315 mile cycle trip from London to Paris. Most of the journey the device was either in my backpack, or tucked away in my saddlebag under my seat. Examining the GPS tracklog showed no significant difference in positioning, despite the fact that my saddle is mainly constructed of metal.


The "Urban Canyons" of Paris didn't seem to cause a problem with the GPS either. Looking at my route through the narrow streets of Paris the data was recorded correctly.


The only time that I recorded "Spikes" in the data appeared to be when turning the GPS on indoors initially the first one or two points could be a little erratic (the worst being 500 miles out) but this soon settles down and accurate points are recorded.


I have also used the Datalogger to record and verify speed camera locations. Essentially what I do is drive at the posted speed limit past a speed camera and then press the POI button.


This accurately records the GPS position and speed. At red lights I make sure I stop to record the position. This is not as good as a dedicated system, but is great for verifying cameras.

eBonTek datalogger

The eBonTek DL-3200 datalogger is an essential part of my cycling technology.

eBonTek datalogger

Analysing the Datalogger tracks.

OK so we have looked at how the datalogger works, but the most important feature of this device is how you can analyse the data that has been recorded.


Part of the eBonTek package is a software disk which contains both the instruction manual and the software drivers and applications.


You need to install the drivers and the application to get going. If you don't already have Google Earth installed then you need to install that as well.


Once the PC has been set up then you are ready to connect the Datalogger to the computer. This is done using the supplied USB cable, though any USB cable is suitable. You must connect to the correct Com Port and you must connect at a baud rate of 115200. Failure to select this baud rate will result in the application not connecting correctly, but with no error message.


Once connected you have 3 sets of options: Configuration, Satellite Info and Data Log List.


Configuration

Depending on your usage requirements you may want to set the datalogger to record in different ways.


For example if you are recording a bike ride you may only want to record a point every 20 meters, but an aircraft you may want to consider every 200 meters. Alternatively you may select to record every 10 seconds irrespective of speed.


There is also an option to record over a certain speed limit. This may be useful to ensure your drivers keep under a specific speed.


The configuration allows you to select multiple options, but it is not clear if it logs if one or more conditions are met, or if all need to be met to log. I have mine set to log every 20 meters which I find is suitable for cycling.


The "Other Setting" configuration option allows you to determine what to do if the log is full. You can either stop logging or overwrite the earliest data.


The rest of the settings are for advanced users only and are not recommended to be used unless you really know what you are doing...


Satellite Information

The Satellite Information pane allows you to monitor what is happening on the GPS. This is not much use on your PC at home, but could be useful on a laptop. This is mainly for diagnostic purposes, but does include a very useful timer for testing Time to Fix times.


Data Log List

The most useful and probably most used part of the application will be the Data Log List. This is the area where you download and manage your track logs.


When you enter this display the left panel of the window shows the


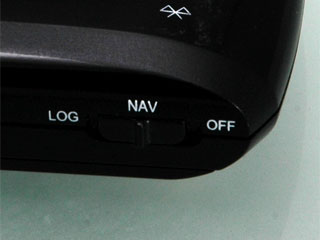
The first thing I do is to click the stop log option. This stops the datalogger recording your current position. This can be a real pain when you have a track recorded in another country or part of the country. Extra points can get added at your PC location.


Next hit the download button. This will then throw up a dialogue display showing you the progress of the download. When the download is complete the dialogue is dismissed, and the data is shown in the grid panel on the right of the window.


Now the data has been retrieved it is time to save it and erase it from the Datalogger. You are given 3 separate format options to save the data: CSV, Google Earth KML or NMEA. If you want to be able to read the data into the application again then you need to save it as CSV.


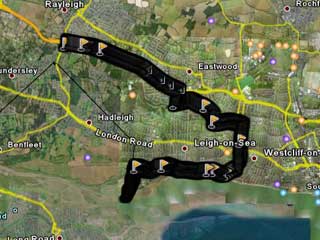
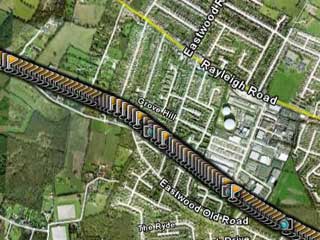
The final option you have is "Draw Map". this option formats the data in the grid and sends it directly to Google Earth.


You have slight control over the style of the plot, but it is restricted to colour, size and opacity. There is no control on the trackpoints which are set to yellow flags and can completely obscure the map.


For some strange reason the software developer thinks that he knows better than the guys at Microsoft (who spend millions on creating user friendly interfaces) and has implemented a strange and difficult to use selection dialogue box. It is really quite difficult to actually select the data you want to display.


Each trackpoint shows the time and date with position, speed and distance from the start. Unfortunately the data is displayed in metric and worse than that it is in meters. 129906.88m is pretty meaningless :D


Now sometime ago I mentioned the button on the datalogger. This is used to record a specific position. When the data is exported to Google Earth this is shown as a camera icon. The data is organised within Google Earth as a single path object. This means that you cannot select the display of these recorded points as a group so you have to search through the mass of trackpoints until you find them.


If you want a short overview of the software click on the video to the right for Quicktime Movie, or here for a Windows Media Player version.

It is difficult to see the detailed route at this level because there are too many trackpoints displayed.


Zooming in the trackpoints are moving apart and we can start to see the recorded POIs showing.


Now we are at the detailed zoom level you can see the black track marker the track points and the recorded POI. Having clicked on the POI the details are displayed.


Conclusions

The concept of the datalogger is a great one, especially as you can display and share your experiences with friends and the world using the interface to Google Earth.


The hardware is based around the the renowned MTK GPS architecture, which produces some amazing results. The power consumption of the unit allows for an entire weekend's activities to be easily captured with power left over.


As this is a datalogger the overall package is seriously let down by the supplied software. eBonTek quote the applications for the device as "Managing Business Trip Expense, Raising Fleet Efficiency, Keeping an eye on Merchandise, and observing driver behavior". In this respect the software does not deliver. The interface to Google Earth is poor and really needs to be improved on.

References

Manufacturers Website

eBontek.com

Pocket GPS Contributor

Mike Barrett

Pocket GPS Contributor Website

www.Pocketgpsworld.com


Comments ?

Have any comments about this review ? Post them here.

CamerAlert Apps


iOS QR Code


Android QR Code


© Terms & Privacy

GPS Shopping